Imbalanced Anomaly Detector
Inspired by Manufacturing Anomaly Detection, I conducted a personal project focused on identifying low-quality wine. In this post, I present an experiment comparing various anomaly and outlier detection techniques on a highly imbalanced dataset. I also explore the characteristics of the dataset, the evaluation metrics employed, and the performance of multiple algorithms to determine which approach yields the best results.
1. The Dataset
For this experiment, we utilized the Wine Quality Dataset (Red Wine).
To frame this as an anomaly detection problem, we applied the following transformations:
- Normal Class (0): Wine quality score ≤ 6
- Abnormal Class (1): Wine quality score > 6
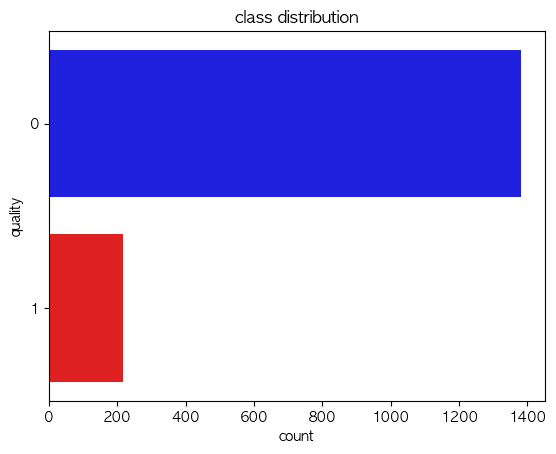
Class Distribution:
- Normal (0): 1,382 instances
- Abnormal (1): 217 instances
This yields a roughly 85:15 class imbalance.
a) EDA
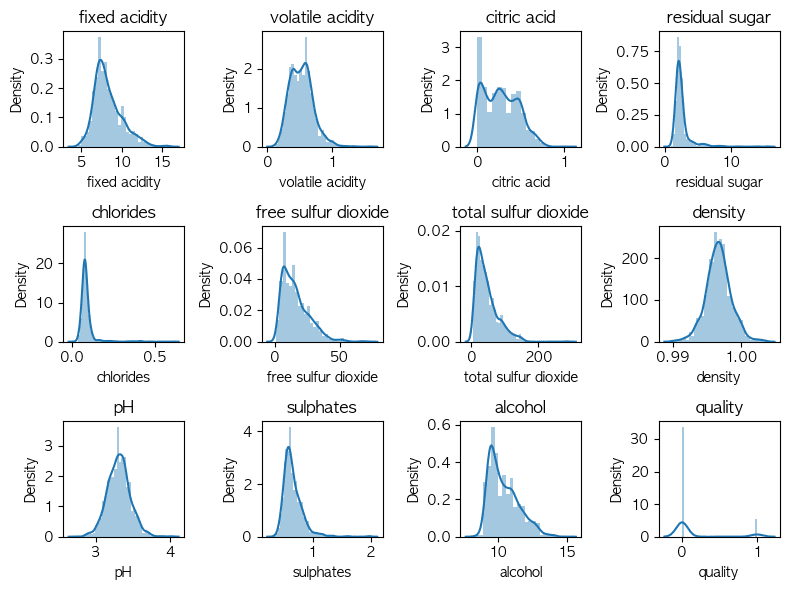 ㄴ I visualized independent variables (features) distribution for check anomaly data's pattern.
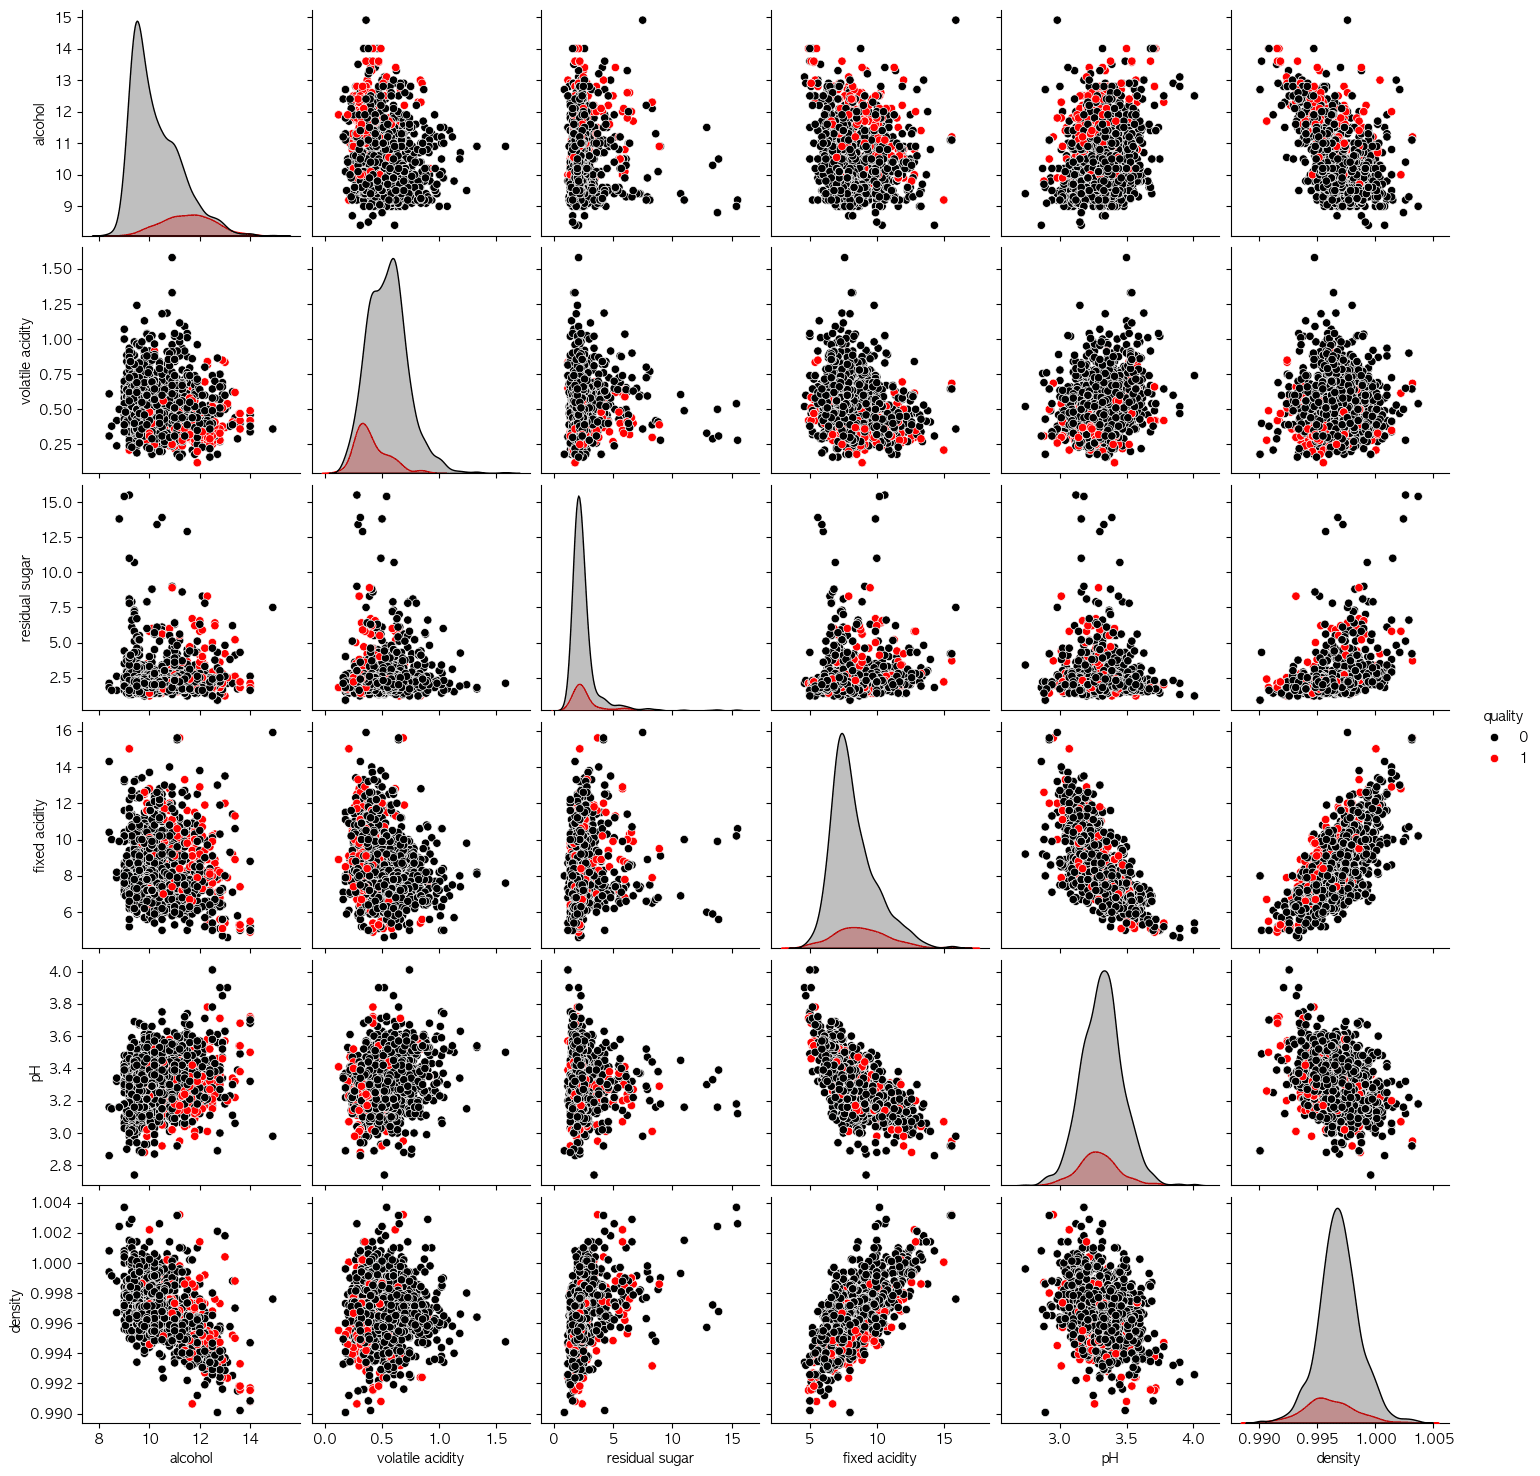 ㄴ Analyzing pairwise distrubutions to identify clusters is a highly effective approach across various use cases.
2. Evaluation Metric: Equal Error Rate (EER)
When evaluating models for anomaly detection, relying purely on accuracy is very misleading due to the severe class imbalance. Predicting everything as "Normal" would still net us 86% accuracy!
Instead, we focus on the Equal Error Rate (EER).
- FAR (False Acceptance Rate): The rate at which abnormal instances are incorrectly classified as normal (= False Positive Rate, FPR).
- FRR (False Rejectance Rate): The rate at which normal instances are incorrectly classified as abnormal (= False Negative Rate, FNR).
The EER is the point on the ROC curve where FAR = FRR. A lower EER indicates a more stable and accurate model, as it balances the trade-off between falsely accepting anomalies and falsely rejecting normal data.
3. The Experiments & Models Tested
We tested an array of classification, clustering, and dedicated outlier detection algorithms on this dataset.
Here are the tested models and their underlying approach:
- PCA / Autoencoder: Reconstruction error based detection. Standard data is easily reconstructed (low error), while anomalies produce high reconstruction error.
- KNN (K-Nearest Neighbors): Distance-based approach. Anomalies lie far away from their K nearest neighbors.
- KMeans: Clustering approach. Anomalies are far from any cluster centroid.
- MoG (Mixture of Gaussians): Density-based approach calculating the probability of data points under a fitted distribution.
- Isolation Forest: Tree-based approach explicitly isolating anomalies rather than profiling normal data.
- One-Class SVM: A classic semi-supervised method capturing the density of the majority class using an RBF kernel.
- Weighted KNN: Distance-based approach similar to standard KNN but weighting the votes by inverse distance.
- ABOD (Angle-Based Outlier Detection): An approach measuring the variance of angles between data points. Normal points within a cluster have high variance in angles to other points, whereas outliers on the periphery have a much smaller variance.
4. Results & Findings
After transforming the data via standardization and testing the models side-by-side on the test set, we calculated the EER & Confusion Matrix for each.
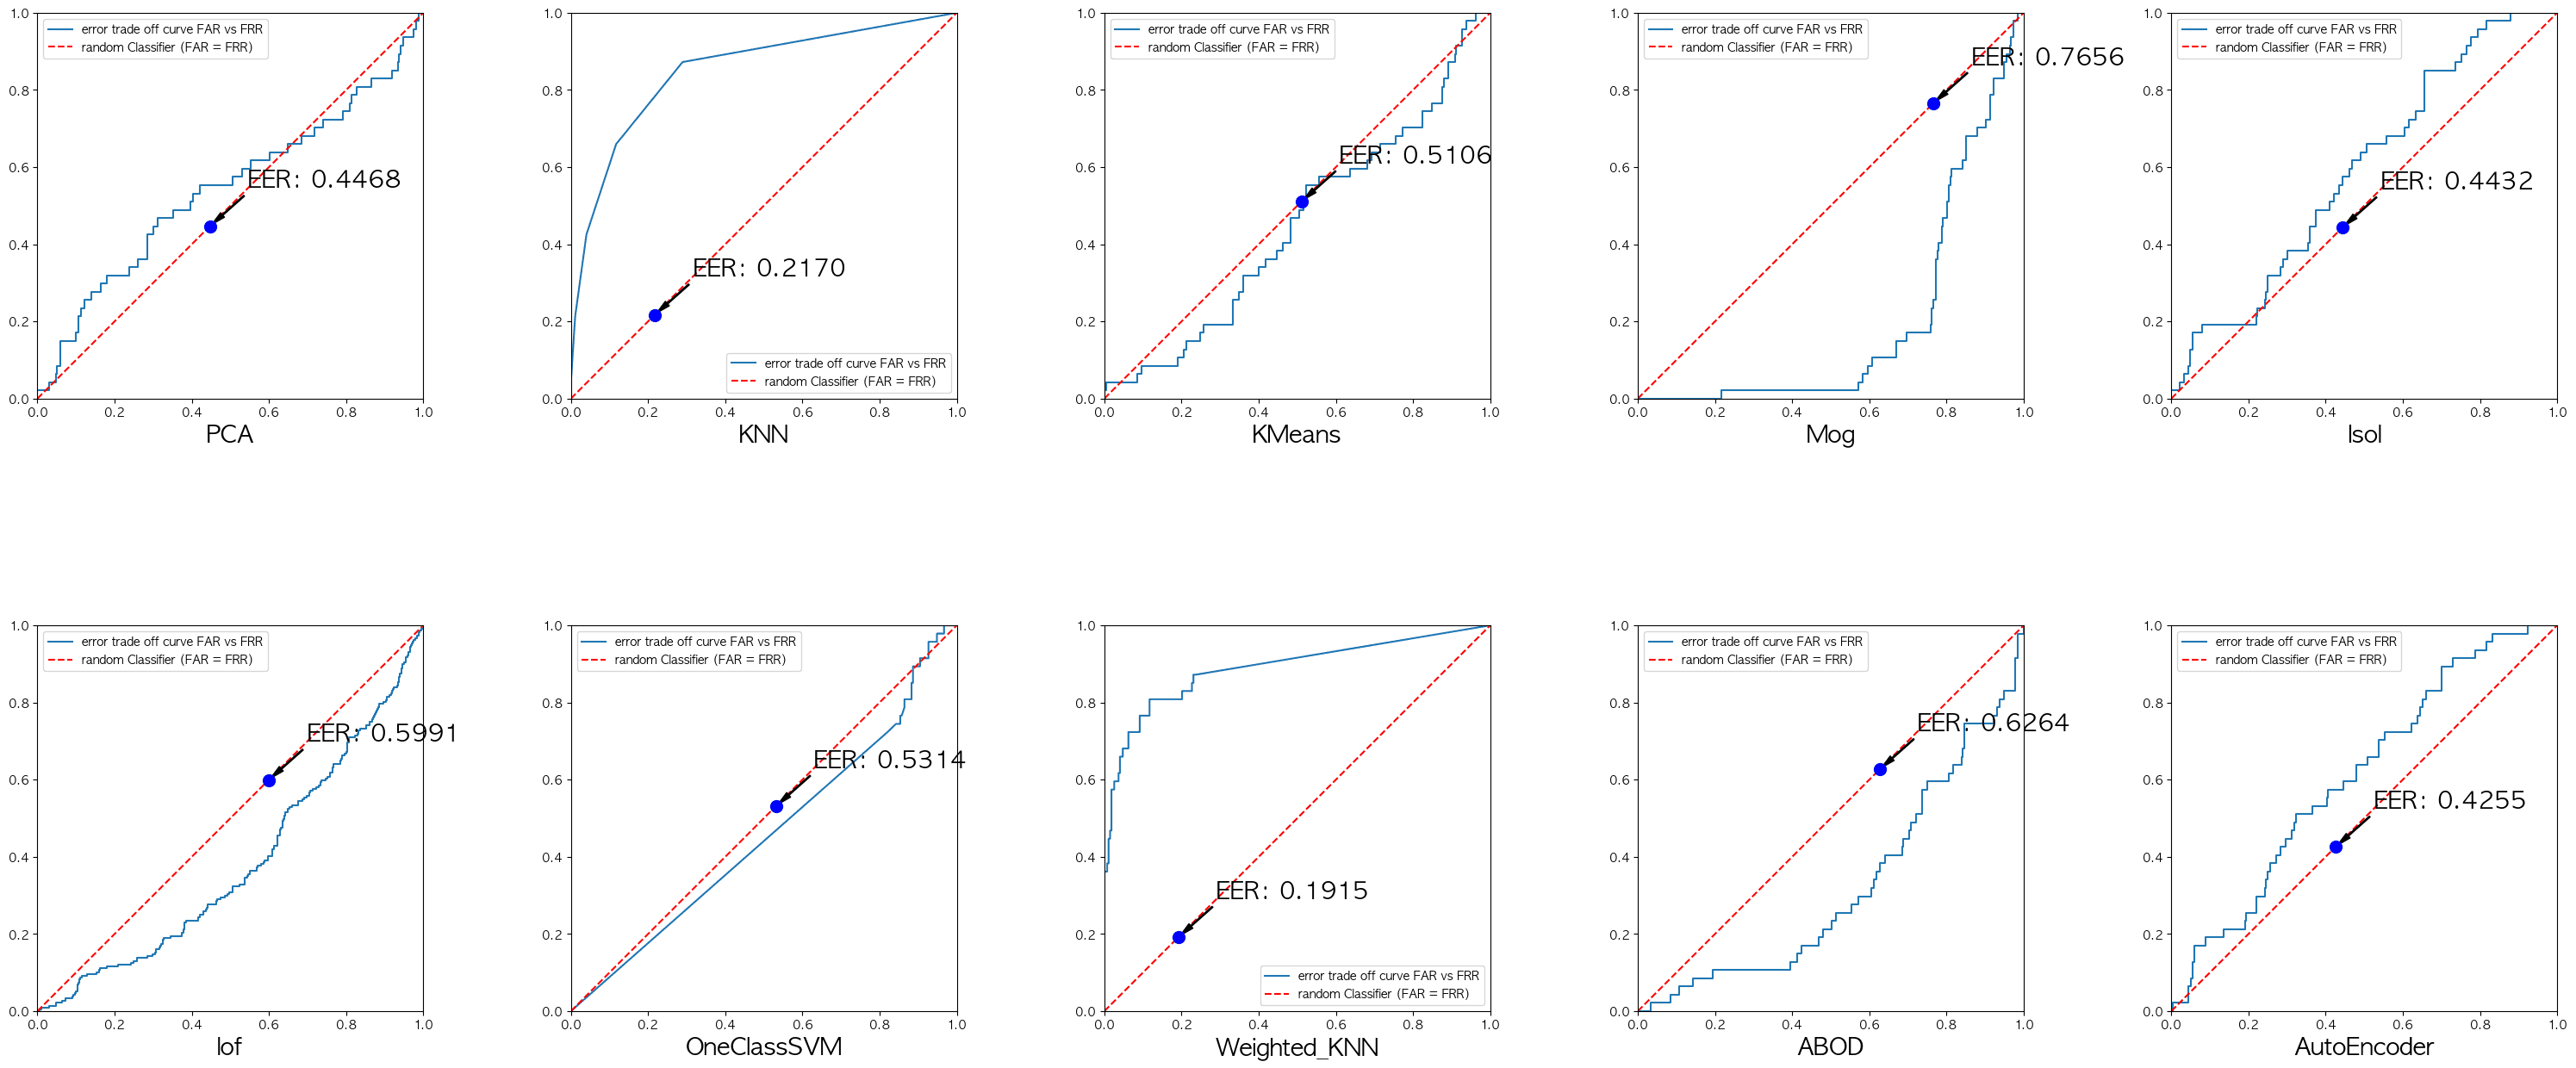
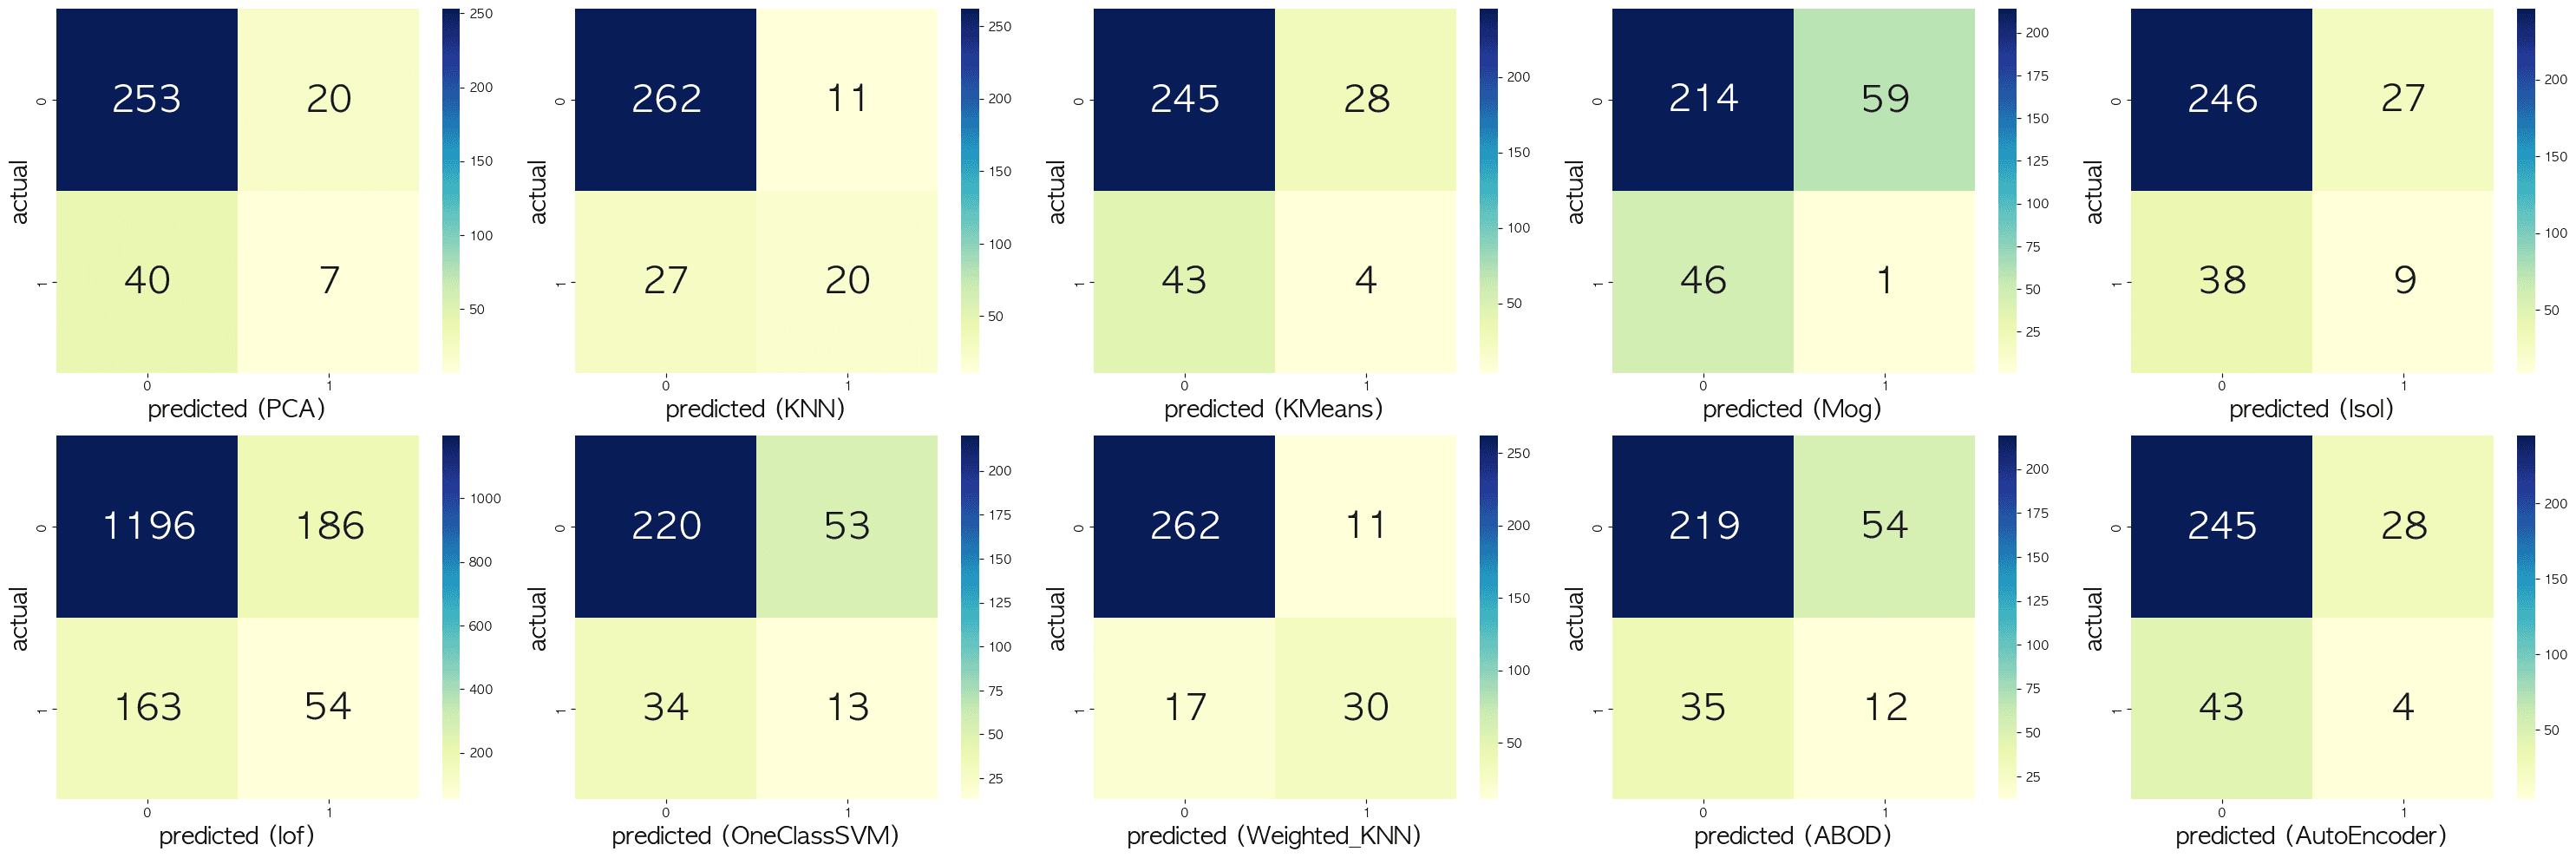
| Model | Equal Error Rate (EER) | Performance relative to others |
|---|---|---|
| Weighted KNN | 0.1915 | 🏆 Best |
| KNN | 0.2170 | 🥈 Excellent |
| Isolation Forest | 0.4432 | Good |
| PCA (Autoencoder-based) | 0.4468 | Good |
| KMeans | 0.5092 | Average |
| One-Class SVM | 0.5314 | Average |
| ABOD | 0.6264 | Poor |
| Mixture of Gaussians (MoG) | 0.7656 | ❌ Worst |
Key Takeaways
- Distance-Based Methods Won: In this specific dataset, standard distance-based methods like KNN and Weighted KNN dominated the leaderboard. The local distance weighting provided by Weighted KNN pushed its EER score below 0.20, effectively trading off false acceptances and false rejections exceptionally well.
- Classic Dedicated Outlier Detectors Struggled: Interestingly, algorithms built specifically for anomaly detection, such as One-Class SVM and ABOD, performed mostly averagely or poorly. One-Class SVM achieved an EER of 0.5314, showing that relying purely on the density estimation of an RBF kernel may struggle to find a good margin inside a highly dense and potentially overlapping feature space.
- Tree-based Isolation works reasonably well: Isolation Forest achieved a modest EER of 0.4432, maintaining its reputation as a consistent and robust baseline algorithm for out-of-the-box outlier detection tasks.
Conclusion
Anomaly detection often requires significant trial and error. As highlighted here, complex or specialized models (like ABOD or MoG) do not always outperform simpler distance-based models (like Weighted KNN) depending on the distribution of the dataset at hand. Understanding and utilizing the Equal Error Rate (EER) gives us a reliable lens to compare these models fairly against the heavily skewed class distributions we face in the real world.